Weekly Market Update: 6 August 2025

Market Undecided as Bitcoin Dominance Holds
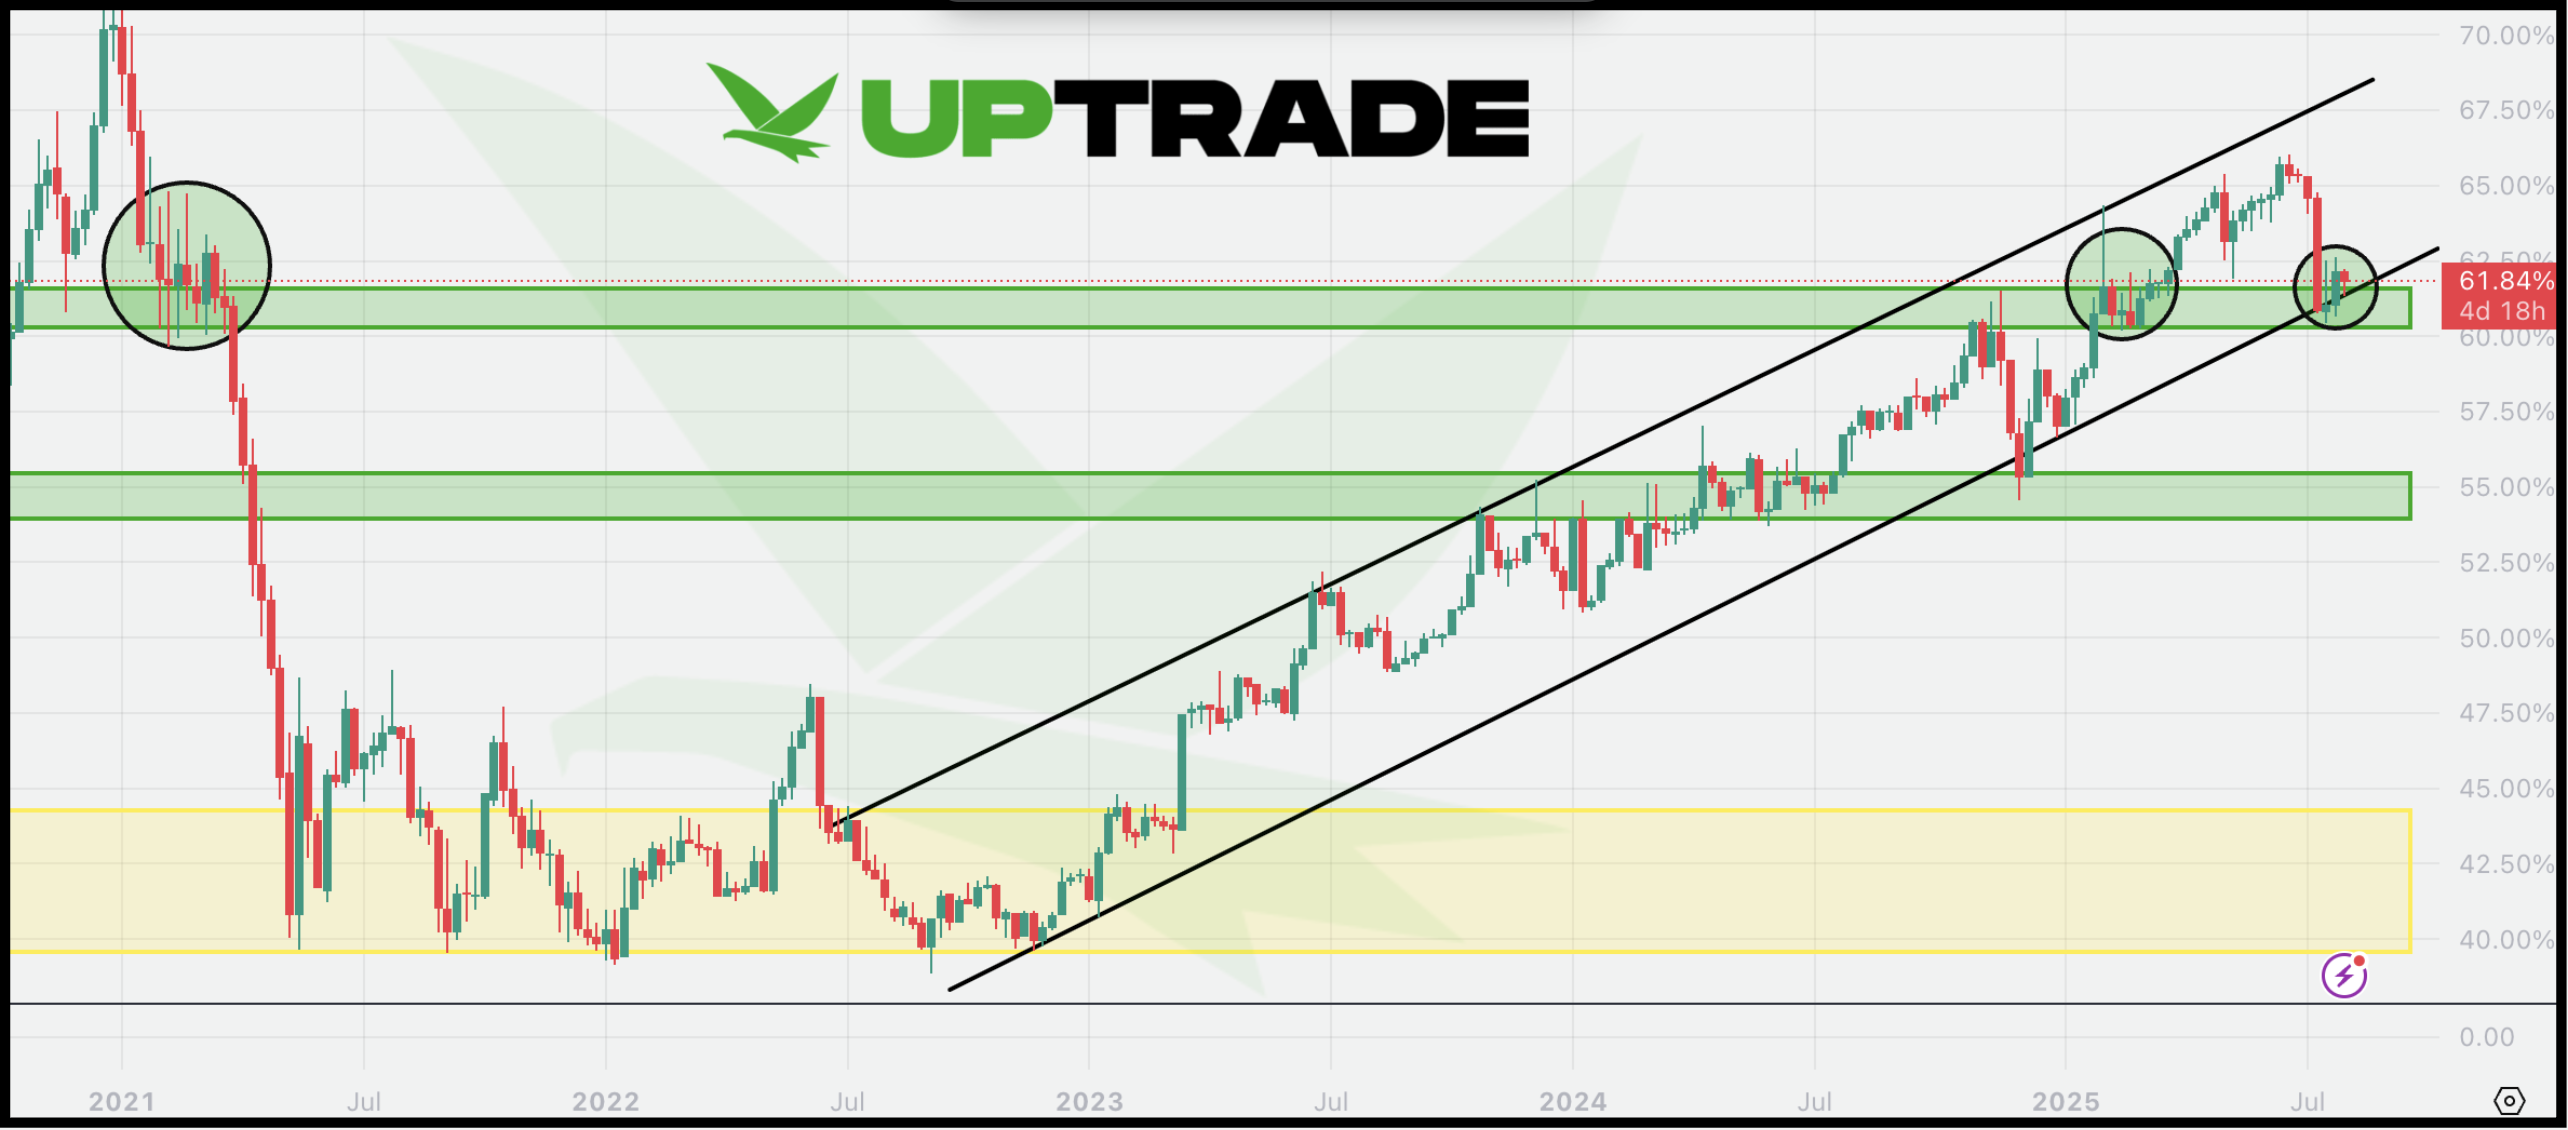
The market remains in a state of indecision, with both Bitcoin and Ethereum trading sideways around key levels, approximately $113K–115K for BTC and $3,500-$3,700 for ETH. Bitcoin dominance (BTC.D) has found support in the 60 - 61.5% range, a historically important zone where the next move, whether up or down, is likely to dictate the next phase of capital rotation.
A sustained move higher from here would typically suggest a shift toward risk-off positioning, favouring BTC. On the other hand, a breakdown in dominance could open the door for renewed strength in altcoins. For now, though, momentum across the board has slowed, and the market lacks a clear leader to drive the next major move. In our view, that catalyst would be a break of Ethereum above the long-term $4,000 mark.
Bitcoin Dominance Chart
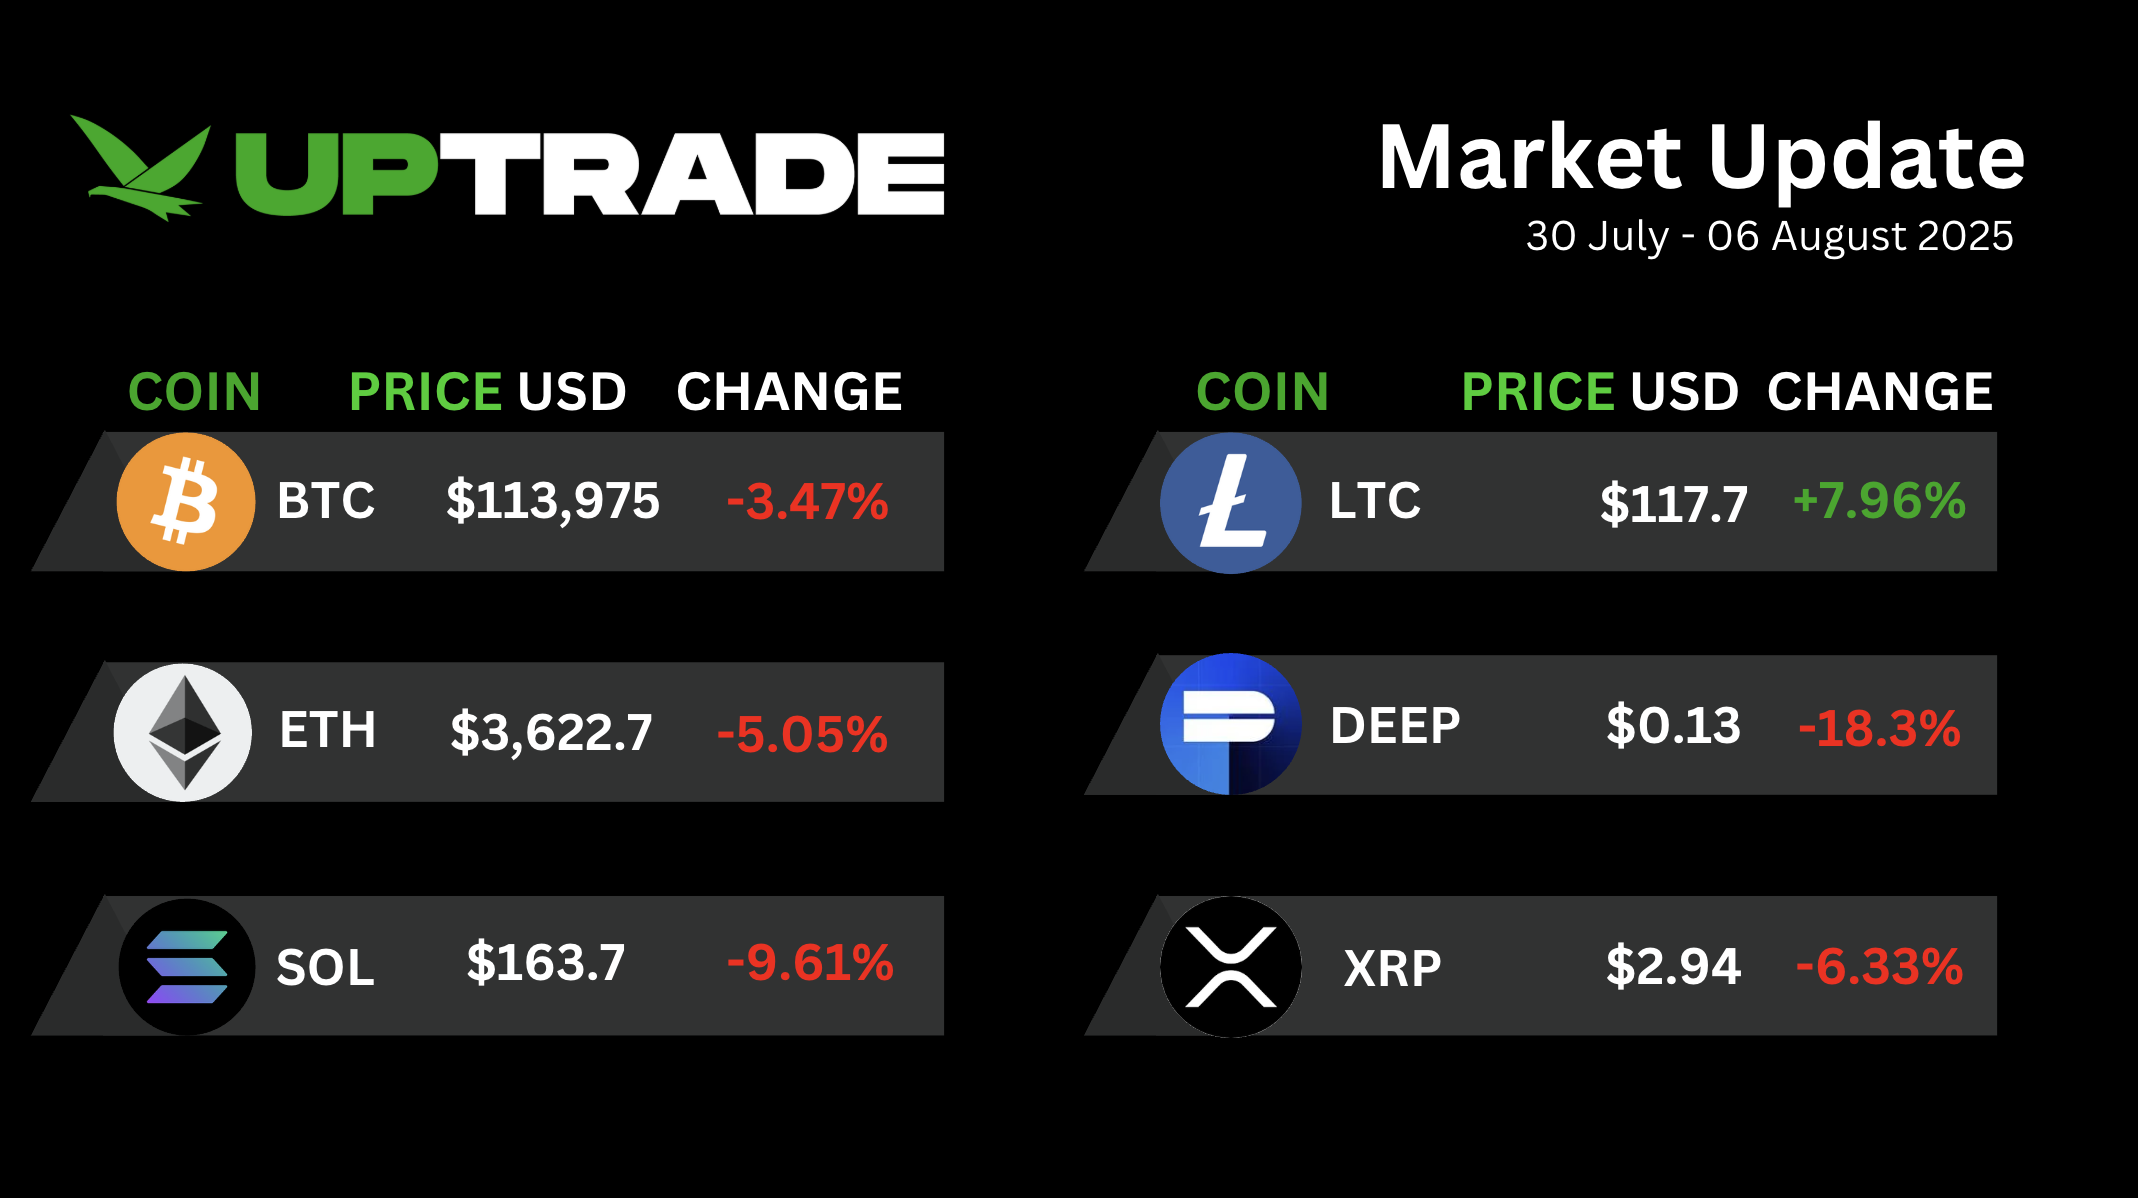
Weekly Price Update
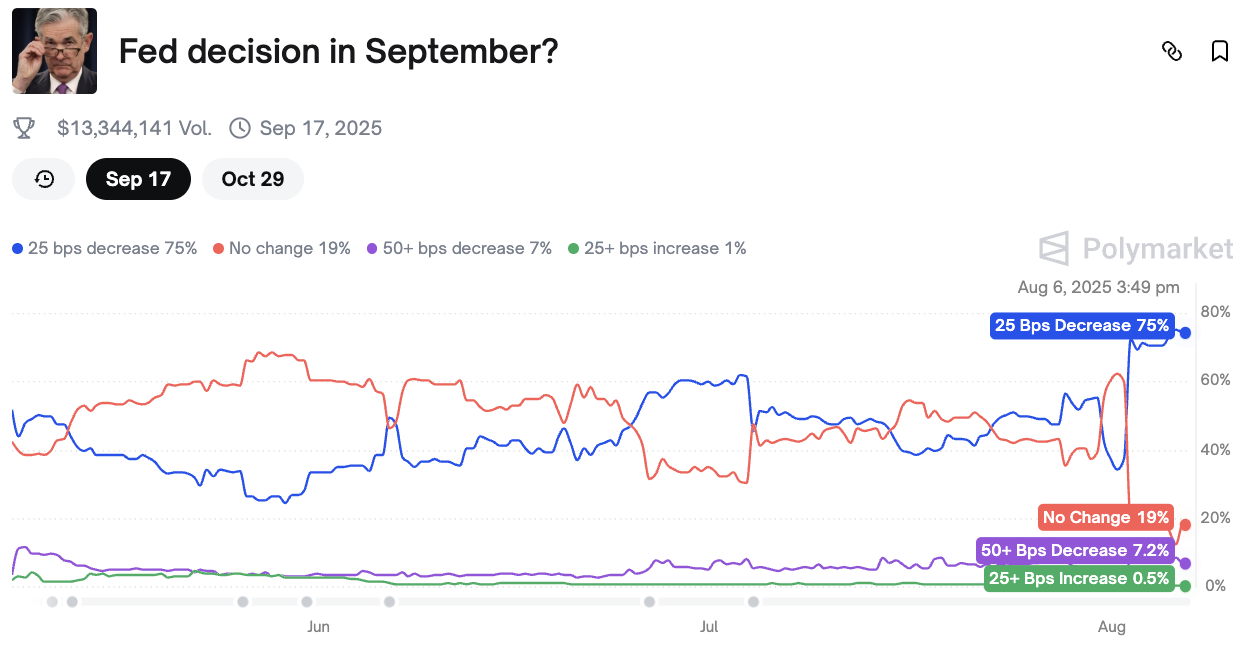
All Eyes On September - Will the Fed Deliver the Catalyst?
The Fed held rates steady at last week’s meeting and made it clear that there is no firm signal yet on whether a cut is coming in September. Powell, in his typically cautious tone, emphasised that the decision remains data dependent as always. This left the market in a state of indecision, with many participants either staying sidelined or shifting to neutral positioning rather than re-risking early.
That said, an 80% chance of a September cut is now predicted, and Goldman Sachs expects three cuts by year-end. It is one of the key catalysts the market has been waiting for this cycle, and that narrative is now being amplified by Trump’s renewed push for aggressive rate cuts to “boom” the economy. While the Fed has not committed yet, sentiment is clearly shifting, and this is the kind of macro fuel we believe the alt-coin market needs to kick off its season.
Who is The Best Fed Chair Pick For Crypto
With Jerome Powell’s term ending in 2026, the race to replace him is underway. President Trump has officially ruled out Treasury Secretary Scott Bessent for the Fed Chair role, Bessent reportedly prefers to stay in his current post. His exit removes what many crypto insiders saw as the most proactive and forward-leaning candidate in terms of digital asset strategy.
Current polymarket odds show Kevin Warsh leading at 43.5%, followed by Kevin Hassett (33.3%) and Chris Waller (23.2%). Each presents a different outlook on crypto and monetary policy, making this decision critical for the future of digital assets in the U.S.
Next Fed Chair Candidates
Kevin Warsh, a former Fed governor and early crypto investor, is the most institutionally focused. He’s previously been a strong advocate for a U.S. CBDC, a major negative for the crypto space, and while he acknowledges Bitcoin’s store-of-value potential, his vision leans more toward centralised digital infrastructure. He’s also expected to favour tighter monetary policy if inflation returns.
Kevin Hassett is the most pro-crypto candidate. With a personal stake in Coinbase and a seat on its advisory board, he aligns closely with private-sector innovation. Hassett supports light-touch regulation, opposes CBDCs, and would likely push for U.S. crypto leadership while maintaining a more accommodative macro stance, making him a strong option for long-term adoption.
Chris Waller, currently on the Fed board, is more skeptical of crypto as an asset but is a firm opponent of CBDCs. He supports private-sector innovation, particularly in stablecoins, and offers a middle ground for those focused on protecting financial freedom from government overreach.
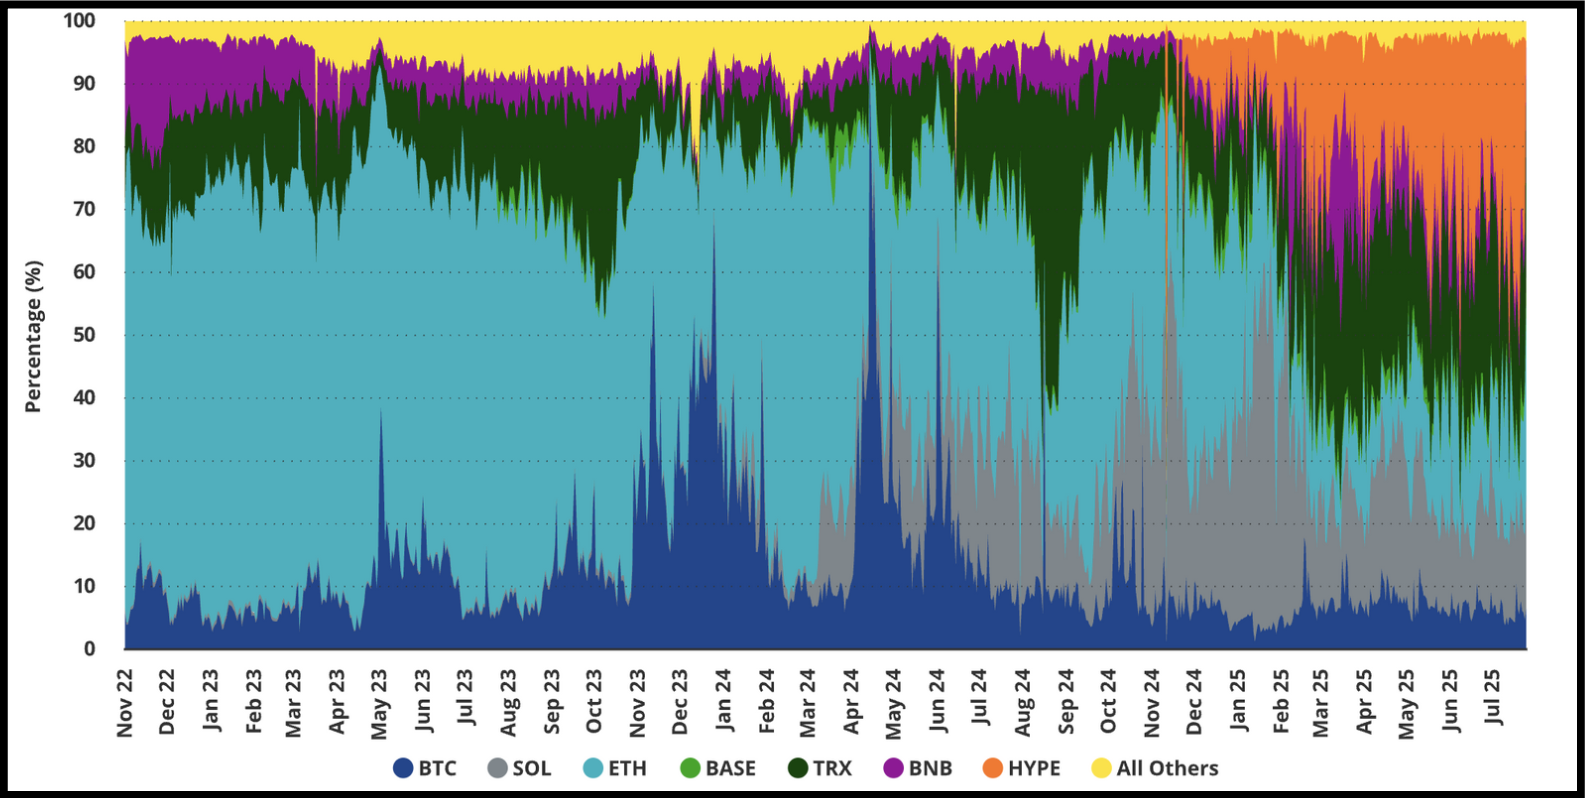
Hyperliquid Captures 35% of All Blockchain Revenue
Hyperliquid just posted its strongest month to date, further solidifying its position as the leading perpetual DEX. In July, the platform processed $320 billion in trading volume, a 47% increase from June’s $216 billion, fuelled largely by alt-coin volatility. Daily fee revenue regularly exceeded $4 million, never falling below $2 million, and total open interest surged past $15 billion for the first time ever. Ethereum led the charge, nearly doubling its open interest over the month. Meanwhile, the Hyperliquid to Binance volume ratio reached an all-time high of 11.89%, showing just how quickly Hyperliquid is closing the gap with the top centralised exchange.
Revenue for July was estimated at $100 million, with 97% of it used to buy back HYPE meaning $97 million worth of HYPE was accumulated in just one month. At that pace, it would take only 6.5 years to buy back the entire HYPE supply, creating one of the strongest token sink models in crypto. Even more impressively, Hyperliquid is the only blockchain in the top 20 with zero VC or private funding, making it arguably the most dominant and organically scaling ecosystem in the space.
Hyperliquid Earned 35% of All Blockchain Revenue in July 2025
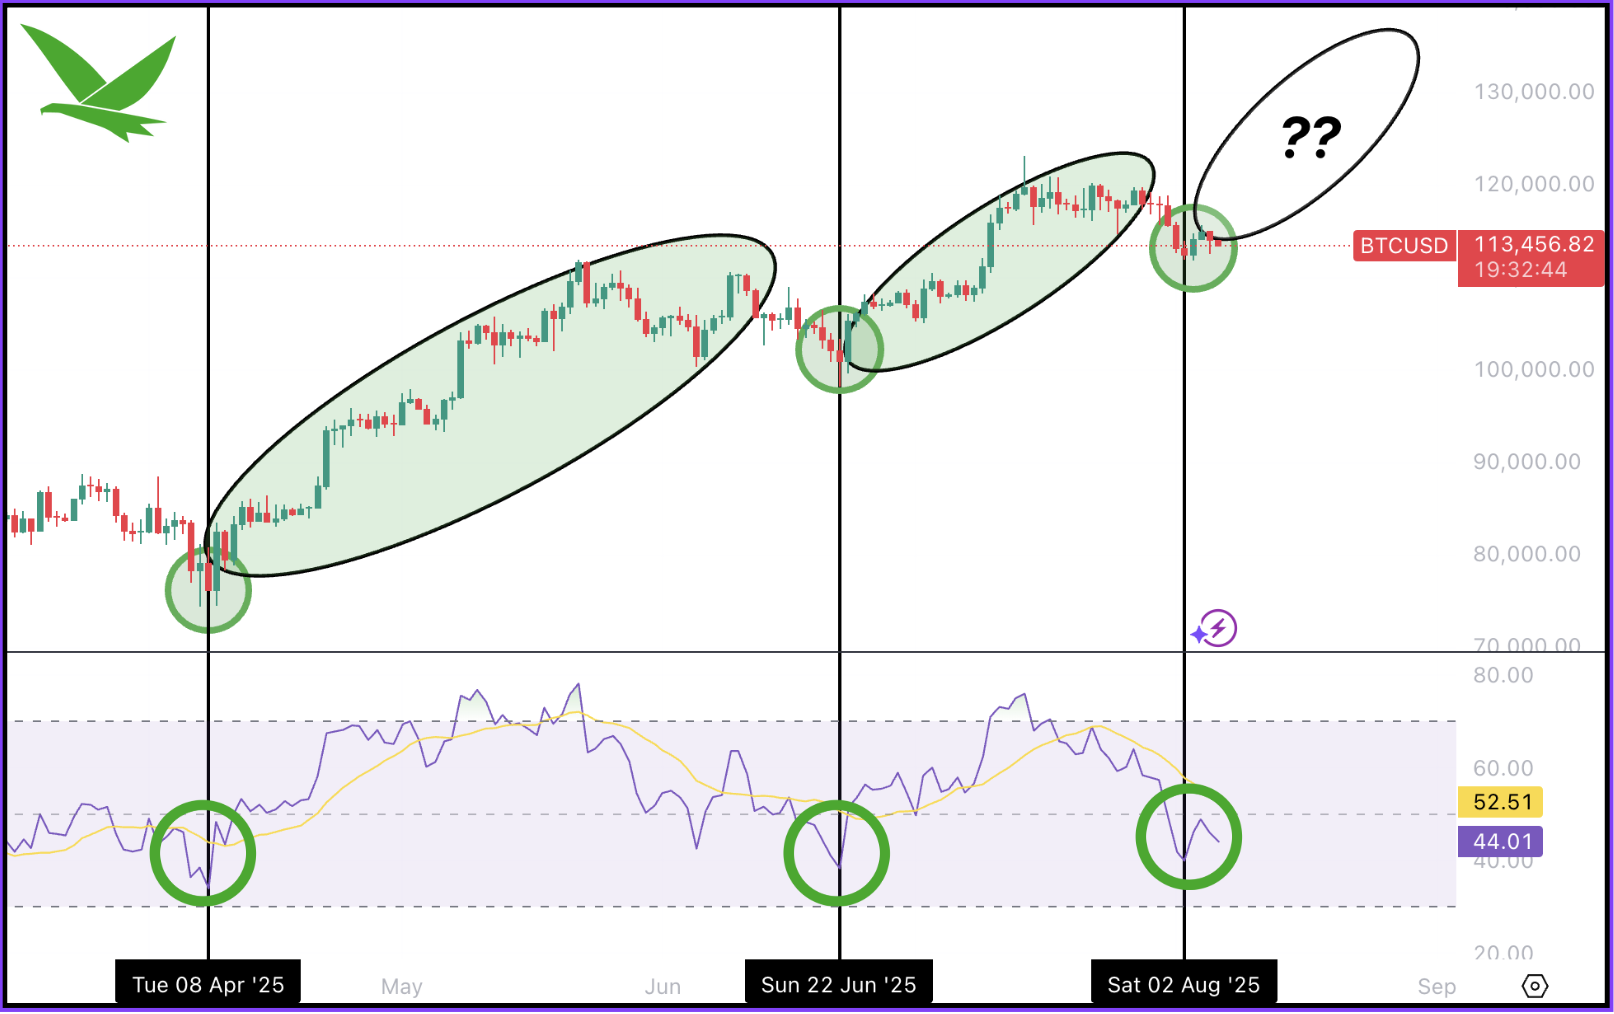
BTC RSI Hits Key Level - Next Move?
One encouraging technical development this week is the broad reset in RSI across major assets. After several weeks of elevated readings and overheated price action, most charts have now cooled into more neutral territory. This type of reset is typical in bull markets as it helps flush out excess leverage and creates the breathing room needed for the next leg higher.
Focusing on the King, Bitcoin’s daily RSI has pulled back into the 40 to 50 range, a zone that historically acts as a base during consolidation phases. Looking back at the last three times BTC reached this range in 2025, each instance marked a local bottom followed by a move to new highs. The most recent reset led to a 25% rally into all-time highs. If price holds here and volume begins to build, this could set the stage for a strong Q4. The chart below illustrates this setup.
BTC Chart + RSI Indicator
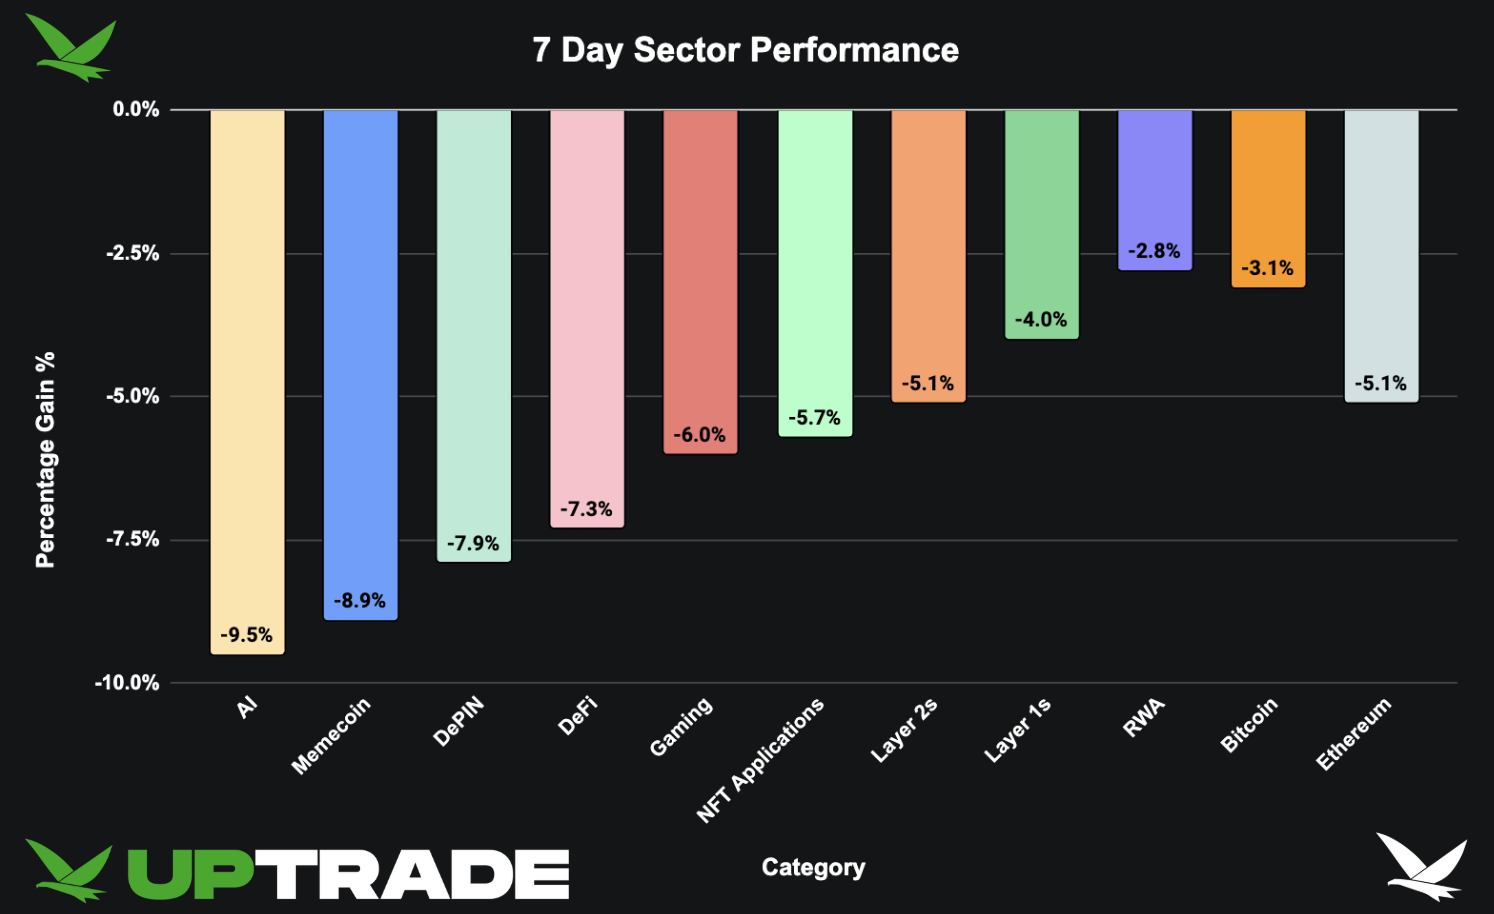
7 Day Sector Performance
This week marked a broad pullback across all crypto sectors, with AI (-9.5%), Memecoins (-8.9%), and DePIN (-7.9%) leading the declines. The sharp reversal reflects cooling sentiment after weeks of strong altcoin inflows, compounded by fading momentum and rotation out of high-beta plays. Even more resilient categories like DeFi (-7.3%) saw significant drawdowns.
Layer 1s and 2s were not spared either, both down around -4% to -5%, while even Ethereum (-5.1%) and Bitcoin (-3.1%) experienced a sell-off. The correction appears healthy in the context of recent rallies, with many sectors now resetting to key support levels and creating higher lows on longer time frames. Traders seem to be actively watching closely to see if this is a brief cooldown or the start of deeper consolidation.
ETF Outflows VS Strategic Treasury Accumulation
BTC ETFs recorded four consecutive days of outflows between July 31st and August 5th, totalling over $1.27 billion in net redemptions. ETH ETFs also saw notable weakness, with daily outflows from 1st to 4th of August, including a record-setting $465 million outflow on August 4th, the largest single day exit in ETH ETF history. While it’s a concerning signal on the surface, the fact that both asset classes sold off simultaneously suggests broader institutional de-risking or capital rotation, which ideally proves to be short-term positioning rather than a sustained trend.
Importantly, this contrasts sharply with what’s happening on the corporate accumulation front. SharpLink recently acquired 83,561 ETH ($304M), bringing its total holdings to 521,939 ETH, part of a growing trend of institutions adopting ETH as a strategic treasury reserve. ETH strategic reserves grew from $9.5 billion to $10.9 billion in just one week, now representing 2.52% of total supply. As long as this trend holds, it helps lay the groundwork for a sustained move toward new highs.
Strategic ETH Reserve Tracker Chart
Thinking About Trading


Weekly Market Update: 18 February 2026
Weekly Market Update: 11 February 2026
Weekly Market Update: 04 February 2026
Weekly Market Update: 28 January 2026

What Does Liquidity Mean in Crypto? A Beginner’s Guide
%20(1).jpg)
How to Build a Diversified Crypto Portfolio
Weekly Market Update: 21 January 2026
Weekly Market Update: 14 January 2026

The Best Crypto Brokers and Trading Platforms for 2026
Weekly Market Update: 07 January 2026
Weekly Market Update: 24 December 2025
Weekly Market Update: 17 December 2025
Weekly Market Update: 10 December 2025
Weekly Market Update: 3 December 2025
Weekly Market Update: 26 November 2025
Weekly Market Update: 19 November 2025
Weekly Market Update: 12 November 2025
.jpg)
SMSF Crypto Investing Australia: A Complete Guide
Weekly Report 5th Nov

DeFi Explained: How Decentralised Finance Is Changing Traditional Banking (Australia, 2025 Edition)
.jpg)
Our Guide to Meme Coins in 2026: How to Pick a Winner
.jpg)
Smart Contract Hacks Australia: How Exploits Happen and How to Protect Your Crypto
.jpg)
Institutional Money in Crypto: How Big Investors Are Changing the Game
.jpg)
Crypto Outlook 2025: Has the Bull Market Been Interrupted or Just Reset?
.jpg)
How Crypto Is Changing the Way We Buy Luxury
.jpg)
Real-World Assets (RWA): The Dominant Crypto Sector of 2025
.jpg)
Crypto Market Manipulation: How Liquidity Squeezes Shape the Market
Weekly Market Update: 22 October 2025
Weekly Market Update: 8 October 2025
Weekly Market Update: 15 October 2025
.jpg)
Crypto Scams Australia: A Beginner’s Guide to Safe Investing
Weekly Market Update: 1 October 2025
Weekly Market Update: 24 September 2025
Weekly Market Update: 17 September 2025
Weekly Market Update: 10 September 2025

Buying Cryptocurrency as a Company: Everything You Need to Know

How to Buy and Sell Large Amounts of Cryptocurrency (Including Bitcoin, XRP, ETH) in 2026
Weekly Market Update: 3 September 2025
Weekly Market Update: 27 August 2025
Weekly Market Update: 20 August 2025
Weekly Market Update: 13 August 2025
Weekly Market Update: 6 August 2025
Weekly Market Update: 30 July 2025
Weekly Market Update: 23 July 2025
Weekly Market Update: 16 July 2025
Weekly Market Update: 9 July 2025
Weekly Market Update: 2 July 2025
Weekly Market Update: 25 June 2025
Weekly Market Update: 18 June 2025
Weekly Market Update: 11 June 2025
Weekly Market Update: 4 June 2025
Weekly Market Update: 28 May 2025
Weekly Market Update: 21 May 2025
Weekly Market Update: 14 May 2025
Weekly Market Update: 7 May 2025
Weekly Market Update: 27 March 2024
Weekly Market Update: 3 April 2024
Weekly Market Update: 10 April 2024
Weekly Market Update: 17 April 2024
Weekly Market Update: 24 April 2024
Weekly Market Update: 1 May 2024
Weekly Market Update: 8 May 2024
Weekly Market Update: 15 May 2024
Weekly Market Update: 22 May 2024
Weekly Market Update: 29 May 2024
Weekly Market Update: 6 June 2024
Weekly Market Update: 12 June 2024
Weekly Market Update: 19 June 2024
Weekly Market Update: 26 June 2024
Weekly Market Update: 4 July 2024
Weekly Market Update: 10 July 2024
Weekly Market Update: 17 July 2024
Weekly Market Update: 24 July 2024
Weekly Market Update: 31 July 2024
Weekly Market Update: 8 August 2024
Weekly Market Update: 14 August 2024
Weekly Market Update: 21 August 2024
Weekly Market Update: 28 August 2024
Weekly Market Update: 4 September 2024
Weekly Market Update: 11 September 2024
Weekly Market Update: 18 September 2024
Weekly Market Update: 25 September 2024
Weekly Market Update: 2 October 2024
Weekly Market Update: 9 October 2024
Weekly Market Update: 16 October 2024
Weekly Market Update: 23 October 2024
Weekly Market Update: 30 October 2024
Weekly Market Update: 6 November 2024
Weekly Market Update: 13 November 2024
Weekly Market Update: 20 November 2024
Weekly Market Update: 27 November 2024
Weekly Market Update: 4 December 2024
Weekly Market Update: 11 December 2024
Weekly Market Update: 18 December 2024
Weekly Market Update: 30 April 2025
Weekly Market Update: 8 January 2025
Weekly Market Update: 15 January 2025
Weekly Market Update: 22 January 2025
Weekly Market Update: 23 April 2025