Weekly Market Update: 20 August 2025

Volatility Returns After Bitcoin All-Time High
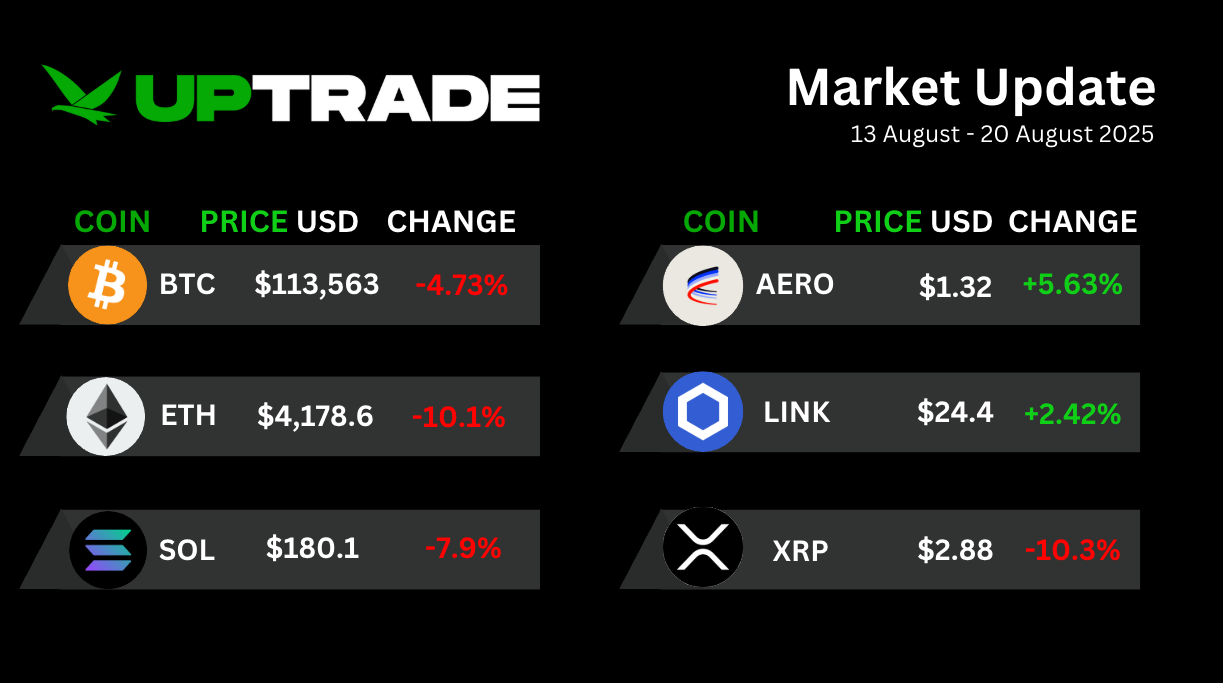
It has been a turbulent week for the crypto market, coming directly off Bitcoin’s new all-time highs and Ethereum trading just shy of its own milestone last week. The rally quickly met resistance as unexpected macroeconomic data unsettled risk sentiment, sparking a wave of selling pressure and heightened volatility across majors. At the time of writing, Bitcoin is consolidating around US$113,000 while Ethereum trades near US$4,100, as investors weigh whether this pullback represents a healthy reset or the early signs of a more extended correction.
Weekly Price Update
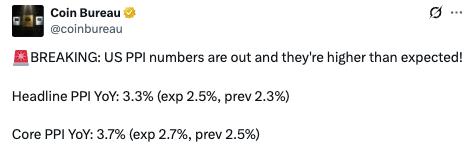
Bearish PPI Inflation Data
The latest Producer Price Index (PPI) came in hotter than expected, sending market sentiment lower and raising concerns about the inflationary impact of Trump’s tariffs. Investors are now questioning what this data could signal for broader inflation trends.
The PPI measures the average change in prices that domestic producers receive for their goods and services. In other words, it captures inflation at the wholesale level, offering an early indication of price pressures that may eventually filter through to consumers.
This quarter, we’ve seen a sharp rise in the PPI alongside a slightly lower Consumer Price Index (CPI). This divergence suggests that producers are absorbing rising costs rather than passing them on to consumers, likely to protect demand and preserve market share. Much of this pressure is believed to stem from recently imposed tariffs. Whether these higher costs eventually reach consumers remains uncertain. Historically, however, the PPI has served as a leading indicator for CPI, as companies eventually adjust pricing strategies once cost absorption becomes unsustainable. The extent of this pass-through will depend on factors like competitive pressures, supply chain shifts, and overall consumer demand.
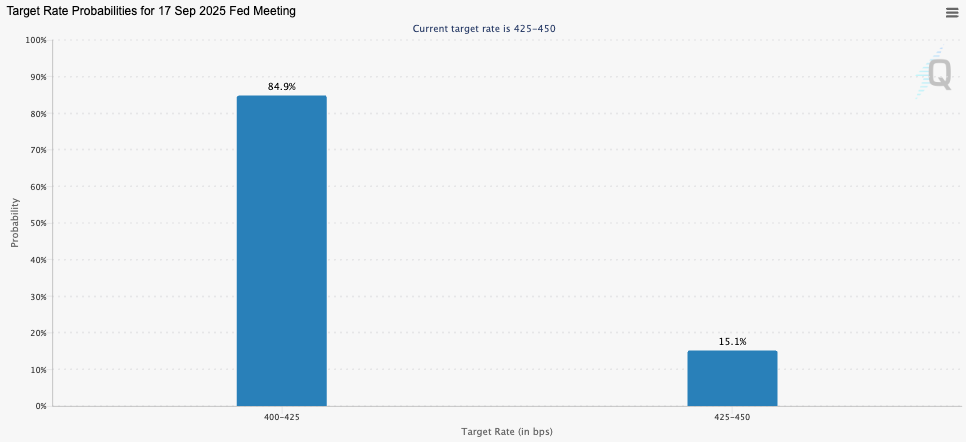
In terms of policy, the hotter than expected PPI data has shifted market expectations. The probability of a rate cut in September has dropped back to 84.9%, compared to almost 99% just last week.
September Rate Cut Odds
Liquidation Shakeout: Constructive or Concerning?
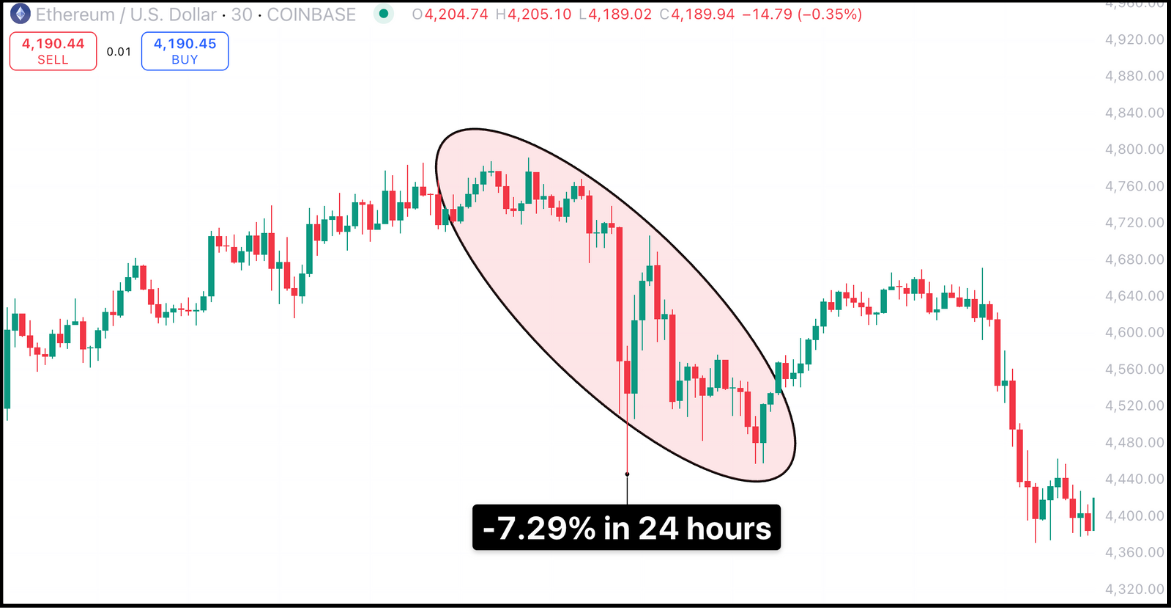
Bitcoin’s recent break to new all-time highs, coupled with Ethereum’s near breakout, has driven heightened volatility, a typical dynamic at such pivotal levels. The release of unexpected macro data caught markets off guard, forcing liquidations among investors who had established late, leveraged positions. On the 14th, more than US$580 million in positions were liquidated, with Ethereum accounting for US$163 million compared with US$77 million for Bitcoin. ETH declined 7.2% within hours, while BTC fell 5.4%.
In the context of a bull market, liquidation cascades can play a constructive role. They reset funding rates, flush out excess leverage, and lay stronger foundations for sustainable price appreciation. That said, this dynamic only holds true if prices stabilise in the near term and resume their upward trajectory, rather than signalling the beginning of a more significant downside shift. In our view, we identified early in the week that the US$4,000 level for ETH and the US$110,000–111,000 zone for BTC are the key levels that must hold to preserve bullish structure.
Ethereum Chart
Institutions Accumulate Ethereum on Market Dip
BitMine Immersion (BMNR) has emerged as the second-largest corporate crypto treasury, behind only MicroStrategy (MSTR). The firm has now accumulated more than US$6.6 billion worth of Ethereum (≈1.52 million tokens), including a US$220 million purchase during the recent dip. This positions BitMine as the holder of approximately 1.26% of Ethereum’s total supply, with stated ambitions to acquire as much as 5%. Led by Tom Lee, the firm has outlined a price target of US$15,000 for ETH by the end of 2025.
SharpLink Gaming, the second-largest Ethereum treasury holder, has also been aggressively adding to its position, now holding 740,800 ETH, and purchasing US$667 million during the latest pullback. While retail sentiment has been rattled by short-term volatility, institutional players continue to use these drawdowns as strategic accumulation opportunities. In total, Ethereum held by ETFs and corporate treasury reserves has now reached roughly 10.5 million ETH or 8.7%.
ETH Reserve Tracker Chart
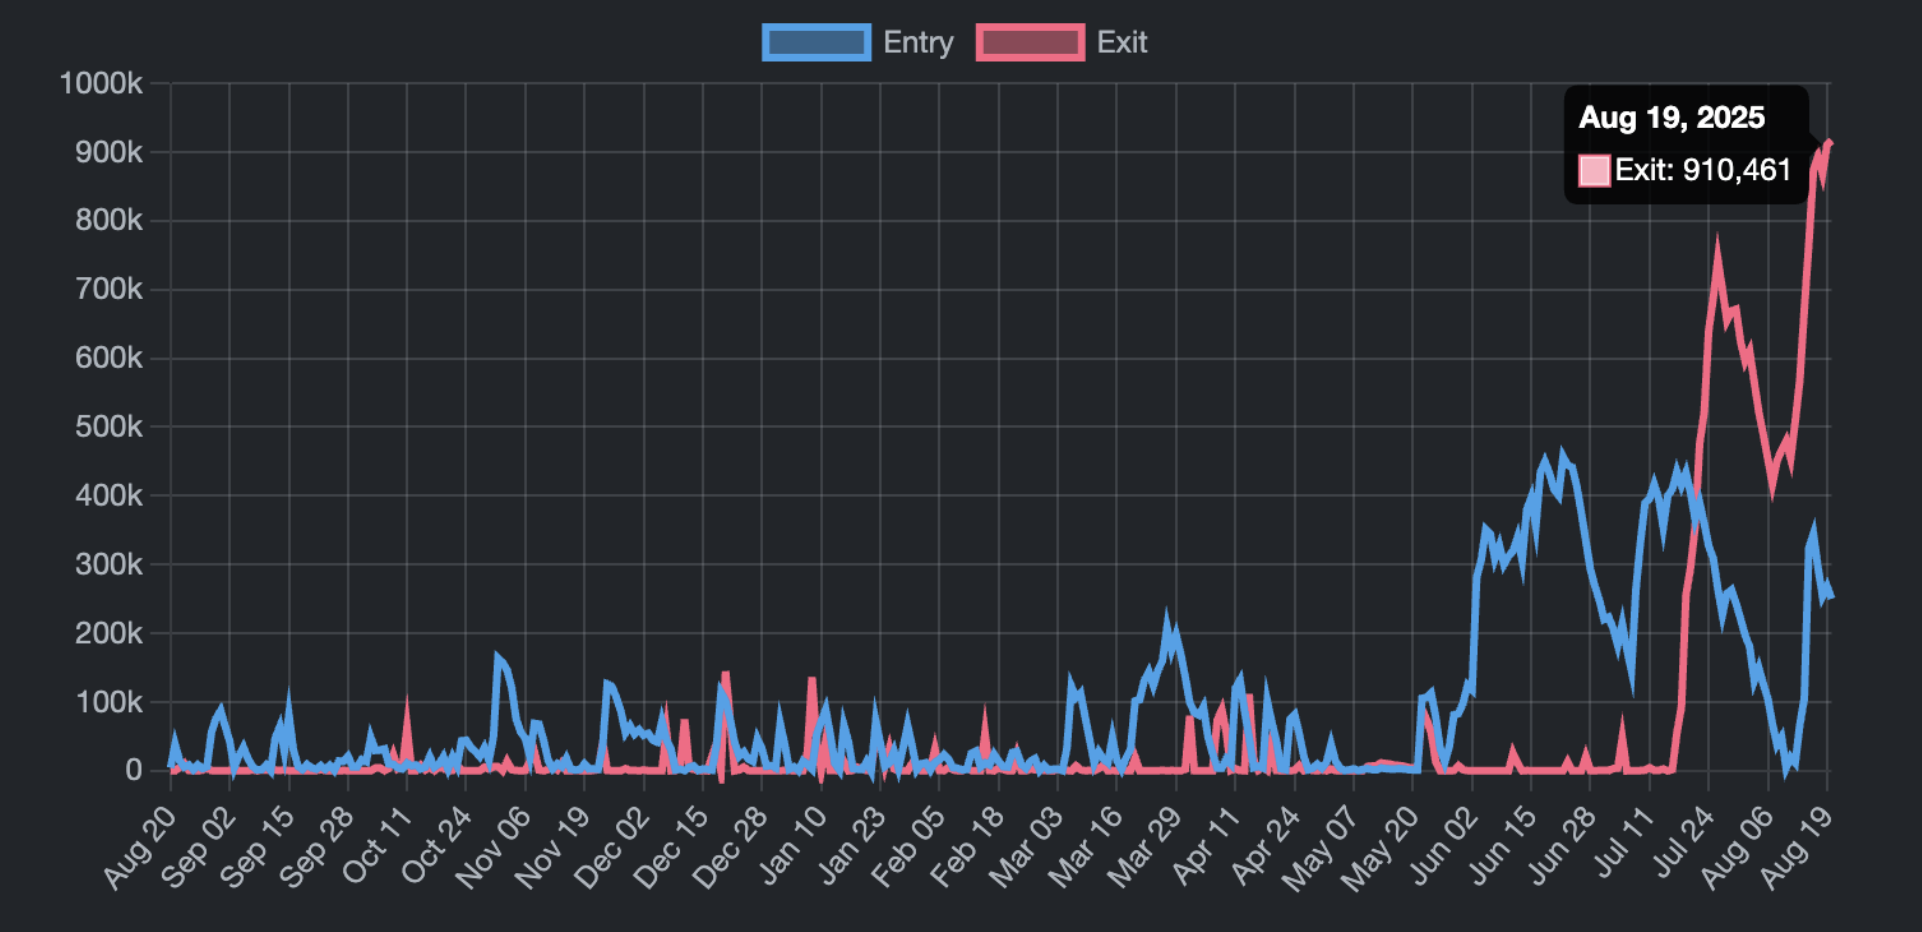
Ethereum Faces Record Unstaking Queues
Ethereum is seeing record unstaking activity, with over 900,000 ETH now in the exit queue. This has raised fears of sell pressure and contributed to the recent pullback. Unstaking on Ethereum is deliberately slow as validators must first clear the exit queue, which is regulated by the churn rate, a cap on how many can enter or exit each epoch (≈6.4 minutes). After this, withdrawals face a further sweep delay before reaching wallets. Together, these mechanisms throttle exits to prevent instability in the proof-of-stake system.
The queue grows whenever more ETH requests to stake or unstake than can be processed at once. While the scale of today’s queue may look alarming, it doesn’t necessarily reflect fading confidence. With ETH trading near all-time highs, much of the withdrawn ETH is likely being rotated into DeFi applications and other Ethereum based products, though it’s equally true that a portion is simply profit taking, adding short-term sell pressure.
Ethereum Validator Queue
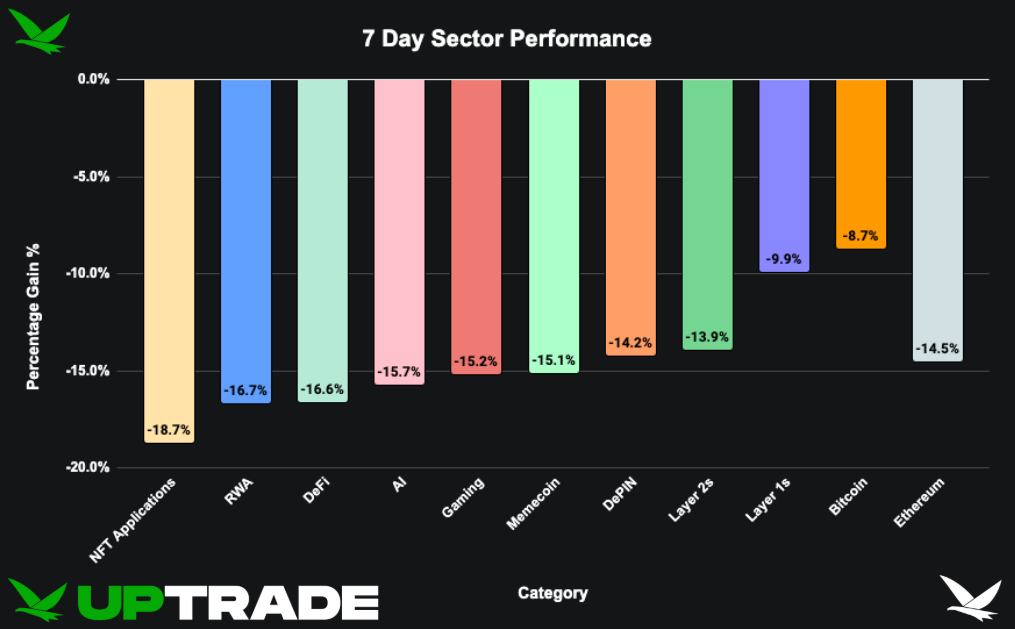
7 Day Sector Performance
This week saw a broad and aggressive pullback across all crypto sectors, with NFT Applications (-18.7%), RWA (-16.7%), and DeFi (-16.6%) among the hardest hit. The decline was largely driven by Ethereum’s sharp reversal (-14.5%) after recently testing its all-time highs. With so many sectors tied directly to Ethereum’s ecosystem—whether through infrastructure (Layer 2s), use cases (DeFi, NFTs), or speculation (Memecoins, DePIN)—its correction triggered a domino effect across the board.
This marks a continuation from last week’s surge, where ETH led the market higher and pulled its ecosystem tokens along with it. Now we’re seeing that relationship cut both ways - as ETH cools, so does the capital rotation into utility and application-layer plays. Even Bitcoin (-8.7%), which had shown relative weakness in prior weeks, couldn’t absorb the outflows, though BTC dominance is now temporarily stabilising as altcoins lose momentum.
The sharpness of the decline reflects a clear reset in risk appetite. This week likely represents a high-beta flush rather than a fundamental shift, and could set the stage for renewed accumulation, once ETH and the broader market find footing again.
Thinking About Trading


Weekly Market Update: 18 February 2026
Weekly Market Update: 11 February 2026
Weekly Market Update: 04 February 2026
Weekly Market Update: 28 January 2026

What Does Liquidity Mean in Crypto? A Beginner’s Guide
%20(1).jpg)
How to Build a Diversified Crypto Portfolio
Weekly Market Update: 21 January 2026
Weekly Market Update: 14 January 2026

The Best Crypto Brokers and Trading Platforms for 2026
Weekly Market Update: 07 January 2026
Weekly Market Update: 24 December 2025
Weekly Market Update: 17 December 2025
Weekly Market Update: 10 December 2025
Weekly Market Update: 3 December 2025
Weekly Market Update: 26 November 2025
Weekly Market Update: 19 November 2025
Weekly Market Update: 12 November 2025
.jpg)
SMSF Crypto Investing Australia: A Complete Guide
Weekly Report 5th Nov

DeFi Explained: How Decentralised Finance Is Changing Traditional Banking (Australia, 2025 Edition)
.jpg)
Our Guide to Meme Coins in 2026: How to Pick a Winner
.jpg)
Smart Contract Hacks Australia: How Exploits Happen and How to Protect Your Crypto
.jpg)
Institutional Money in Crypto: How Big Investors Are Changing the Game
.jpg)
Crypto Outlook 2025: Has the Bull Market Been Interrupted or Just Reset?
.jpg)
How Crypto Is Changing the Way We Buy Luxury
.jpg)
Real-World Assets (RWA): The Dominant Crypto Sector of 2025
.jpg)
Crypto Market Manipulation: How Liquidity Squeezes Shape the Market
Weekly Market Update: 22 October 2025
Weekly Market Update: 8 October 2025
Weekly Market Update: 15 October 2025
.jpg)
Crypto Scams Australia: A Beginner’s Guide to Safe Investing
Weekly Market Update: 1 October 2025
Weekly Market Update: 24 September 2025
Weekly Market Update: 17 September 2025
Weekly Market Update: 10 September 2025

Buying Cryptocurrency as a Company: Everything You Need to Know

How to Buy and Sell Large Amounts of Cryptocurrency (Including Bitcoin, XRP, ETH) in 2026
Weekly Market Update: 3 September 2025
Weekly Market Update: 27 August 2025
Weekly Market Update: 20 August 2025
Weekly Market Update: 13 August 2025
Weekly Market Update: 6 August 2025
Weekly Market Update: 30 July 2025
Weekly Market Update: 23 July 2025
Weekly Market Update: 16 July 2025
Weekly Market Update: 9 July 2025
Weekly Market Update: 2 July 2025
Weekly Market Update: 25 June 2025
Weekly Market Update: 18 June 2025
Weekly Market Update: 11 June 2025
Weekly Market Update: 4 June 2025
Weekly Market Update: 28 May 2025
Weekly Market Update: 21 May 2025
Weekly Market Update: 14 May 2025
Weekly Market Update: 7 May 2025
Weekly Market Update: 27 March 2024
Weekly Market Update: 3 April 2024
Weekly Market Update: 10 April 2024
Weekly Market Update: 17 April 2024
Weekly Market Update: 24 April 2024
Weekly Market Update: 1 May 2024
Weekly Market Update: 8 May 2024
Weekly Market Update: 15 May 2024
Weekly Market Update: 22 May 2024
Weekly Market Update: 29 May 2024
Weekly Market Update: 6 June 2024
Weekly Market Update: 12 June 2024
Weekly Market Update: 19 June 2024
Weekly Market Update: 26 June 2024
Weekly Market Update: 4 July 2024
Weekly Market Update: 10 July 2024
Weekly Market Update: 17 July 2024
Weekly Market Update: 24 July 2024
Weekly Market Update: 31 July 2024
Weekly Market Update: 8 August 2024
Weekly Market Update: 14 August 2024
Weekly Market Update: 21 August 2024
Weekly Market Update: 28 August 2024
Weekly Market Update: 4 September 2024
Weekly Market Update: 11 September 2024
Weekly Market Update: 18 September 2024
Weekly Market Update: 25 September 2024
Weekly Market Update: 2 October 2024
Weekly Market Update: 9 October 2024
Weekly Market Update: 16 October 2024
Weekly Market Update: 23 October 2024
Weekly Market Update: 30 October 2024
Weekly Market Update: 6 November 2024
Weekly Market Update: 13 November 2024
Weekly Market Update: 20 November 2024
Weekly Market Update: 27 November 2024
Weekly Market Update: 4 December 2024
Weekly Market Update: 11 December 2024
Weekly Market Update: 18 December 2024
Weekly Market Update: 30 April 2025
Weekly Market Update: 8 January 2025
Weekly Market Update: 15 January 2025
Weekly Market Update: 22 January 2025
Weekly Market Update: 23 April 2025